This is a guest post by Chris Gillham, who maintains http://www.cycle-helmets.com/, a rich repository of facts and statistics on Australia’s helmet law disaster.
A new American study has cast further doubt on the ability of bicycle helmets to prevent concussions, at the same time raising questions about their tendency to cause more bike accidents and injuries due to factors such as risk compensation.
The paper’s title, Helmet Usage Reduces Serious Head Injury Without Decreasing Concussion After Bicycle Riders Crash more or less speaks for itself, as in the abstract:
There was no significant difference in the number of patients with a concussion in riders with or without helmets, [299/701, 42.6% versus 86/205, 42.0%, respectively].
The lack of concussion prevention should come as no great surprise as earlier studies have suggested only a 14.9% decline in 6-17yo cyclist concussions in the US from 2006-2010 to 2011-2016, despite a 17.6% decline in cycling participation, and a 42.9% increase in 18yo+ cyclist concussions despite a participation increase of just 12%.
Perhaps more surprising is that the study over nine years of 906 head injured cyclist patients at the Marin County Trauma Centre near San Fransisco reports that 77% of them had been wearing helmets when they crashed.
Do 77% of cyclists in Marin County wear helmets? Almost certainly not, and this echoes claims by the Royal Perth Hospital Trauma Centre in Western Australia that about 20% of its cyclist admissions each year hadn’t been wearing a helmet, despite about 50% of cyclists in the Perth metropolitan area not wearing helmets at any given time.
Helmet wearing proportion
So what’s the average proportion of helmet wearing among cyclists in the US? There’s no easy answer but four different sources (1, 2, 3, 4) provide an average 58.5% of children and 41.0% of adults regularly wearing helmets. Add an arbitrary 5% to make up for a possible increase in helmet wearing since the surveys were done and it’s probably close to the mark to estimate that 63.5% of children and 46% of adults in the US currently wear bike helmets.
There are 22 American states including the District of Columbia that have statewide helmet laws for children and teenagers, some up to age 18, and more than 201 localities have local ordinances. The first state youth helmet laws began in 1993 and the last to be enacted was New Mexico in 2007. In voluntary jurisdictions, there is immense parental and school pressure for children to wear helmets.
Cycling participation
How about cycling participation? Outdoor Industry Association (OIA) surveys suggest a 36.8% decline in 6-17yo cycling participation from 2006 to 2016. Alternatively, US Census Bureau data suggest a 42.5% decline in 7-17yo cycling participation from 1995 to 2009. OIA figures show a 15.5% increase in 6yo+ cycling from 2006 to 2016, with numerous studies reporting that’s because of an increase in adult cycling – particularly among baby boomers.
The following is extracted from another new US paper, Is bicycling getting safer? Bicycle fatality rates (1985–2017) using four exposure metrics, based on the National Household Travel Surveys (NHTS) and showing the number of child cyclist trips in 1995 was 221.9% higher than 1985 but by 2017 was only 18.5% above the 1985 level.

There’s also a graphic below of NHTS results showing the percentage of trips by American children and teenagers dropped from about 58% in 2001 to 22.1% in 2017. Million daily bike trips per annum within this youth demographic fell by 48.9% from 2009 to 2017.

It’s apparent that as in Australia and New Zealand, the primary cycling participation demographic has switched from children to adults over the past 20 years. Force kids to wear uncomfortable and inconvenient helmets because cycling is dangerous and they’ll otherwise probably die, and fewer kids ride bikes.
Total cyclist injuries are a fairly good proxy for participation as it can be assumed that if more people are cycling there’ll be more crashes and injuries, and vice-versa.
Cycling injuries
The National Electronic Injury Surveillance System (NEISS) maintained by the US Consumer Product Safety Commission provides a reliable source of cyclist injury data from 2000 to 2019, so let’s have a look at trends over the past 20 years – mindful that child/teenager participation has at least halved over that time and adult cycling has increased by about 20%.

The table above suggests that from 2000 to 2019 there was a significant increase in the hospitalised proportion of all cyclist injury presentations at American emergency departments.
From 2000 to 2019, during which time both mandatory and voluntary helmet wearing increased substantially in all age groups, the proportion of head injures fell slightly for children and teenagers but increased for adults, while concussion ratios increased for both demographics.
It’s noteworthy in the table above that although the head proportion of all injuries for 0-19yo decreased slightly, the percentage is still greater than for adults who aren’t compelled by law and wear fewer helmets.
The average annual number of all 0-19yo cyclist injuries declined by 32.45% from 2000-2009 to 2010-2019 (339,175 > 229,105) and the average number of hospitalised 0-19yo cyclist injuries declined by 25.08% (13,087 > 9,805). Compare that with the NHTS figures showing the percentage of trips by 5-15yo Americans dropped from about 58% in 2001 to 20.1% in 2017, and by 48.9% from 2009 to 2017.
Let’s turn the spotlight on different measurements within the NEISS data.

The decline in 0-19yo injuries might prompt helmet law advocates to claim success, but the decadal reduction of 32.4% is unlikely to match the participation decline within that demographic. The 35% increase in adult injuries is disturbing, particularly as there’s been an ongoing increase in helmet wearing that should prevent head injuries.
There’s a difference between cyclist injuries that just need a bandaid and cyclist injuries that put you in hospital, so let’s compare them across all ages in the US.

A 7.6% decadal reduction in all cyclist injuries and a 51.4% increase in hospitalised injuries doesn’t suggest that injuries are becoming less severe.
So what’s the demographic trend among all those extra cyclists going to hospital?

The 25.1% decadal reduction in 0-19yo hospitalised injuries is unlikely to match the youth participation decline and the 118.5% increase in adult hospitalised injuries is alarming, particularly as adult participation certainly didn’t increase by 118.5% from 2000 to 2019.
Helmets prevent head injuries so how have the demographics trended since the year 2000?

The 34.2% decadal decline in 0-19yo head injuries may be in the same ballpark as the decline in child/teenage cycling participation, but the 53.5% increase in adult head injuries again doesn’t match the smaller participation increase.
Since a majority of US children and teenagers wear helmets, have they enjoyed a greater reduction in head injuries than injuries to other body parts?

Yes, they have, and the 1.71% greater decadal reduction in head injuries over the past 20 years suggests about 2,500 fewer head injures across the US averaged over the past decade if based on the 147,941 head injuries in 2000. That’s about 250 per year, or five less head injuries per year in each American state among 0-19yo cyclists.
So how about those concussions that the new American study suggests aren’t prevented by wearing a helmet? Most American children and teenagers wear bike helmets so let’s see how they’re faring with concussion trends.

The decadal reduction in 0-19yo cyclist concussions is about half the reduction in total injuries and well below all survey estimates of the reduction in US youth cycling participation. That suggests their concussion rates have worsened.
Let’s check if the increased voluntary wearing of helmets by American adults has reduced their numbers ending up in hospital with a head injury.

It might be argued the 8.84% smaller increase in hospitalised head injuries compared to total hospitalised injuries among the 20yo+ demographic is because of helmets, but both total and head injuries have more than doubled while adult cycling participation has not.
The 317.5% increase in adult cyclist head injuries from the year 2000 to the year 2019 should ring alarm bells. It’s noteworthy that in 2019 America set a new record for hospitalised adult cyclists at 40,468 (up from 40,369 in 2018) and a new record for hospitalised adult head injuries at 15,055 (up from 11,331 in 2018).
How about concussion trends among adult cyclists?

As with children and teenagers, there’s a strong suggestion that concussion numbers have worsened among adults at about twice the rate as other injuries. The new US paper has probably understated the lack of concussion protection from helmets as the NEISS data suggests a disproportionate increase in concussion injury, possibly because of rotational forces associated with the greater head diameter created by helmets.
Another way to gauge helmet effectiveness is to compares all head and non-head injuries.

There was a 2.34% greater decadal decrease in head than non-head injuries, which equates to about 4,487 fewer head injures across the US averaged over the past decade if based on the 191,752 head injuries in 2000. That’s about 448 per year, or almost 10 less head injuries per year among all ages in each American state.
We can shine the spotlight on the 0-19yo demographic.

There was a 3.60% greater decadal decrease in head than non-head injuries among 0-19yo cyclists, which equates to about 5,326 fewer head injures across the US averaged over the past decade if based on the 147,941 head injuries in 2000. That’s about 532 per year, or just over 10 less head injuries per year among 0-19yo cyclists in each American state.
And adults?

There was a 22.11% greater decadal increase in head than non-head injuries among 20yo+ cyclists, which equates to about 9,685 more head injures across the US averaged over the past decade if based on the 43,805 head injuries in 2000. That’s about 968 per year, or just over 19 more head injuries per year among 20yo+ cyclists in each American state.
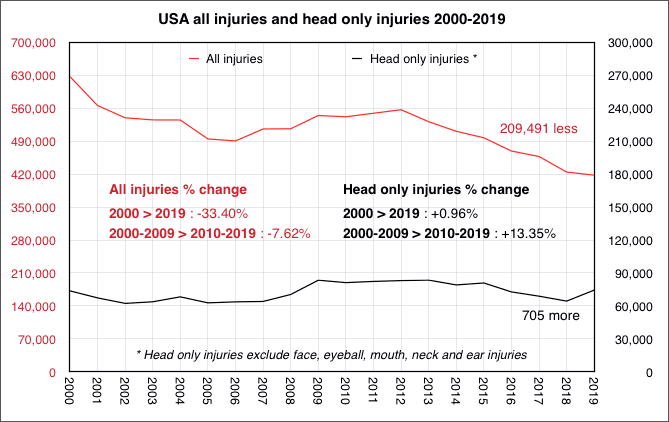
And, finally, perhaps the most damning of the NEISS figures … a comparison of all cyclist injuries with head only injuries that exclude face, eyeball, mouth, neck and ear injuries. Bicycle helmets are essentially designed to prevent injuries to the head, the skull and what’s inside, not the body parts below.

So all cyclist injuries have decreased substantially since the year 2000 but head only injuries have increased.
The all injury reduction is because far fewer American children and teenagers are cycling. A significant majority of this demographic wear helmets, so how have they fared with head only injuries?

On average, the reduction in head only injuries suffered by young American cyclists has been about 10% less than the reduction in overall injuries.
And how about the frequency of head only injuries suffered by adult American cyclists compared to their overall injuries?

An average 35.09% more overall injuries and 81.21% more head only injuries from 2000-2009 to 2010-2019, despite a large increase in voluntary helmet wearing. Comparing the year 2000 with 2019, the 174.63% increase in head only injuries suggests the ever-increasing use of helmets by adult cyclists is increasing rather than reducing the number of head only injuries.
It’s difficult to interpret these results other than an indictment of helmets increasing the proportion of overall, head and head only injuries to American cyclists of all ages, yet in late 2019 the National Transportation Safety Board recommended that all-age mandatory bicycle helmet laws be enforced in all US jurisdictions.
The US total population increased 16.8% from 2000 to 2019 (281,710,909> 329,064,917). The 0-19yo demographic increased 1.44% (80,473,265 > 81,630,000) and the 20yo+ demographic increased 22.72% (200,948,641 > 246,600,000). Cycling per capita has plunged in the 0-19yo demographic and possibly remained on par with population growth in the 20yo+ demographic.
Other studies
The findings above are currently (September 2020) the most up-to-date in the world and advance the findings of previous published studies such as Bicycle Trauma Injuries and Hospital Admissions in the United States, 1998–2013, which showed cyclist injuries up from 8,791 in 1998-99 to 15,427 in 2012-13, with the head injury proportion up from 10% to 16%, the torso proportion up from 14% to 17%, the extremity injury proportion down from 59% to 52%, and the other body part injury proportion down from 17% to 16%.
This study reports an increase in bicycle-related injuries and hospital admissions in adults in the United States between 1998 and 2013. The increase in overall injuries was driven by an increase in injuries in individuals older than 45 years. The increase in hospital admissions outpaced the increase in overall injuries, perhaps due to an increase in severe injuries in older individuals, who made up a greater proportion of injured cyclists in 2012–2013 compared with 1998–1999. These injury trends likely reflect the trends in overall bicycle ridership in the United States in which multiple sources show an increase in ridership in adults older than 45 years.
Estimated total costs from non-fatal and fatal bicycle crashes in the USA: 1997–2013 calculated the cost of nonfatal biking injuries in the US rose by nearly 140% from $9.3 billion in 1997 to $22.4 billion in 2013.
It’s worth noting Australian Institute of Health and Welfare (AIHW) studies showing the number of cyclist hospital cases increased 59.9% from 7,520 in 1990 to 12,027 in 2016. National Cycling Participation surveys show 18.2% of Australians cycling at least once a week in 2011 dropping to 15.5% in 2017, yet AIHW figures show cyclist hospital cases rising 33.6% from 9,001 in 2011 to 12,027 in 2016.
Conclusion
As in Australia and New Zealand, cycling participation has and will continue to decline in America as baby boomers who learned to cycle as kids without helmets retire their bikes due to age, but are not replaced by declining numbers among younger discouraged cyclists. America is the fattest nation on earth.
Countries with mandatory all-age and youth bicycle helmet laws will continue to suffer the public health and road traffic consequences of reduced cycling, while data such as above shows cycling itself becomes less safe and with more injuries likely caused by an increase in accidents per cyclist.