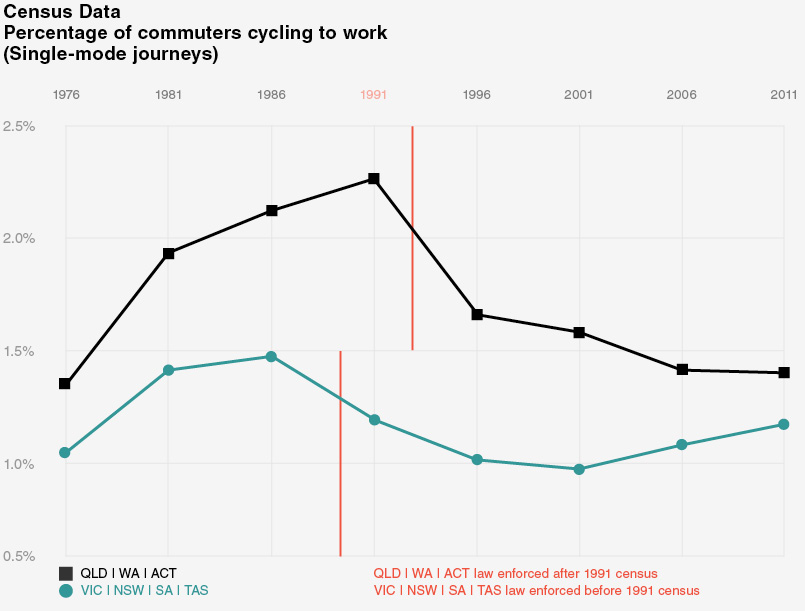
The percentage of people using bikes to get to work is measured every five years in the Australian Census. You probably remember filling in the big census form every five years yourself. Helmet laws reduced the number of people cycling dramatically, and numbers are still lower today than before helmet law came in.
Apart from dragging down progress towards better cycling conditions and getting more people using bikes, this also means that fewer people are getting the health benefits of riding a bicycle to work. Even if the claimed benefits of helmet law are as big as governments make out, the health effects of getting less exercise are a much bigger loss. Overall, helmet law reduces the people’s life-span, increases disease and costs the health budget money. See Prof Piet de Jong’s paper (Professor of Actuarial Statistics, Macquarie University).
Below is a graph of census data on transport in New Zealand. Helmets were made compulsory in New Zealand in 1994.
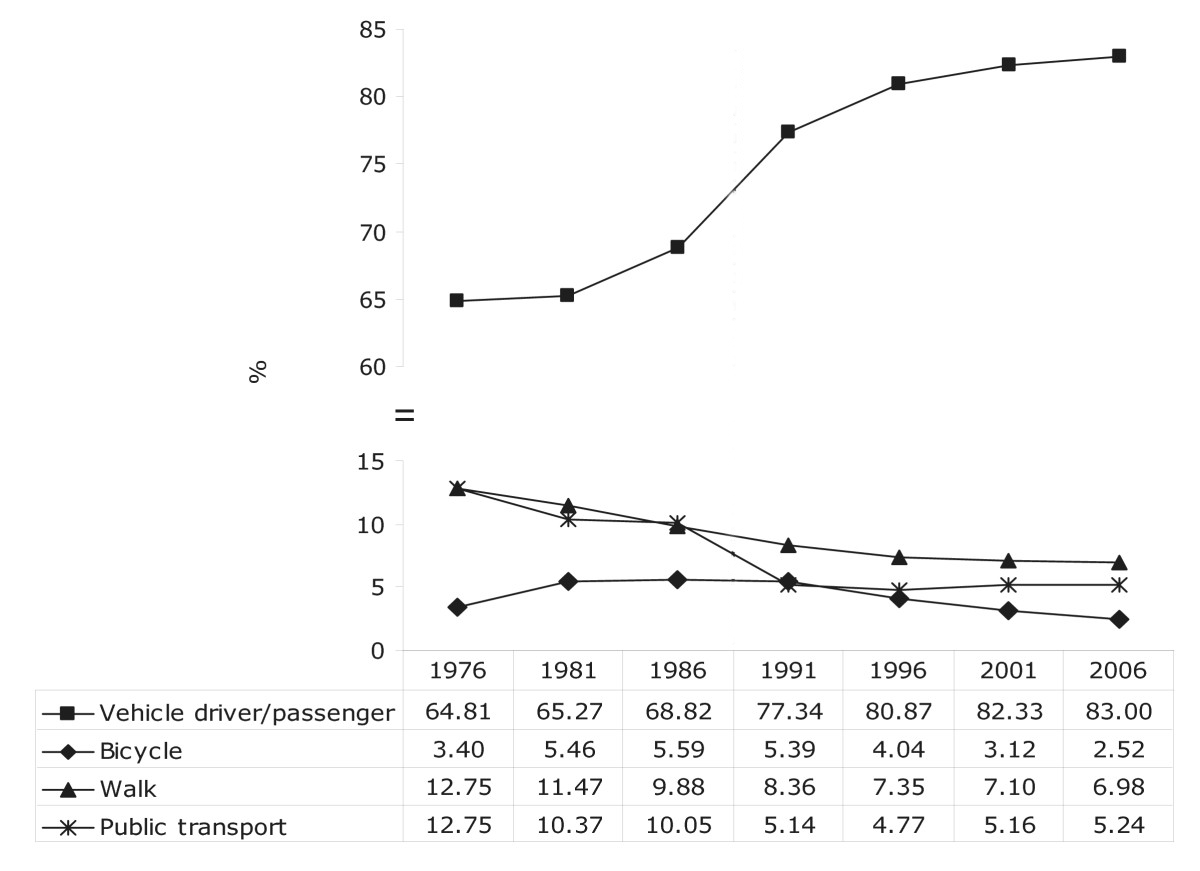
taken from Sandar Tin Tin et al, International Journal of Behavioural Nutrition and Physical Activity. Also in New Zealand, In 1987/88, before the introduction of helmet laws, 4.4% of New Zealanders cycled to work, 11.6% cycled to primary school and 18.6% to secondary school. By 2004/08, only 2.2% and cycled to work, 4.3% to primary school and 4.9% to secondary school. These data are from NZ Ministry of Transport: How New Zealanders Travel. Spreadsheet available at: www.transport.govt.nz/research/travelsurvey/latestresults.
Above is from http://www.cycle-helmets.com/zealand_helmets.html
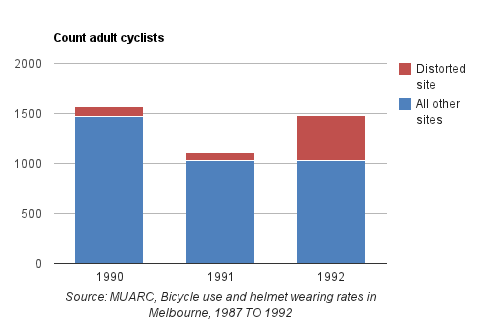
In Victoria, the study relied on by the Government to claim that cycling didn’t decrease after helmet law shows the opposite. The count in 1990 was pre-law. Both counts post-law shows a large drop except for one site at which a large organised group of over 400 cyclists inflated the final year’s average. The chart at right is from http://crag.asn.au/2621 and shows the numbers at the distorted site in red. The study was funded by Vicroads who didn’t fund a further year’s count, as they couldn’t be sure another big event would prop up their figures.
In Perth, two bridges carried most of the road traffic across the Swan River. Here are the before and after figures for numbers of cyclists:
Graphic from http://www.cycle-helmets.com/
Below is a graph of head injuries and non-head injuries to cyclists in Victoria, taken from Carr, D., M. Skalova, and M. Cameron, Evaluation of the bicycle helmet law in Victoria during its first four years, 1995, Rpt 76 Monash Univ Acc Res Centre Melbourne. Helmet laws had no effect on the ratio of head to non-head injuries, but all injuries dropped, showing the effect of helmet law was to decrease cycling but not to decrease head injuries:
This one graph tells us a lot. Introduction of helmet laws discourages the safest cyclists, and changes the mix of cycling activities in the population – because racing cyclists and mountain-biking cyclists wear helmets as a matter of course, the law doesn’t affect them. Everyday cycling, the safest type of cycling, is discouraged because most people won’t do this type of riding if they feel it is unsafe. So the mix of accidents also changes – the type of risky cycling that is more likely to result in head injuries becomes a larger share of cycling crashes. So even though a helmet may offer some level of protection in the event of a crash, a helmet law removes the safest cyclists and those least likely to have a head injury in the first place. By discouraging this type of cycling, the health benefits lost outweigh any gain from increasing helmet wearing rates.
If you logically follow the path and strategies of helmet laws you would need to make compulsory the wearing of gloves for protecting hands! Full length clothing for legs and arms….etc…..etc Just wrap us in cotton wool!!
Strangely no one is considering banning SMOKING, we know that cost the health system millions of dollars!!
nice manipulation of data, Nic
Do the first graph on number of riders, not mode share
Thanks for the insult, “manipulated” indeed. Who is “Nic” by the way? The second graph, taken from a published paper, is also mode share. Anything wrong with that? Mode share is used because it removes changes due to population growth, or employment participation for example. Mode share is the percentage of trips that people choose to make by a given mode. In case you didn’t read the other pages, that’s why helmet law is counter-productive, it reduces the number of trips people choose to make by bicycle.
I think the recreational rather than work commuter cycling trends are a better reflection of the helmet law’s impact on Australian cycling participation. Many work cyclists were already addicted to helmets and lycra by 1990-92 so the law’s discouragement wasn’t as significant as among normal people :-). The recreational plunge, based on ABS data, is charted near the top of the home page of http://www.cycle-helmets.com.
In essence, Australian recreational cycling had recovered by 2011/12 to almost match post-law 1994 levels, but again fell significantly by 2013/14. With enormous population growth since then, the per capita cycling rate in 2013/14 was 41.7% lower than 1994. The series begins in 1994 because that’s when the ABS started its surveys, and it’s likely that the recreational cycling decline was already significant since helmet law enforcement in 1990-92.
By the way, the Narrows and Causeway cyclist graphic above is from cycle-helmets.com but is originally a scan from the Main Roads WA official survey, so the 37% decline from 1991 to 1992 is hard data.